
Introduction
“Today, people, nations and economies are more connected than ever, and so are the global development issues we are facing. These issues span borders, straddle social, economic and environmental realms.
From urbanization to the creation of jobs for millions of people, the world’s challenges will only be solved using approaches that take both complexity and local context into account. For almost thirty years, UNDP’s human development approach - with its emphasis on enlarging people’s freedoms and opportunities rather than economic growth - has inspired and informed solutions and policies across the world.” Achim Steiner, Administrator, UNDP
Human Development Indices and Indicators: 2018 Statistical update is being released to ensure consistency in reporting on key human development indices and statistics. With its comprehensive statistical annex, our data gives an overview of the state of development across the world, looking at long-term trends in human development indicators across multiple dimensions and for every nation, the 2018 Update highlights the considerable progress, but also the persistent deprivations and disparities.
2018 snapshot of the state of human development across the world
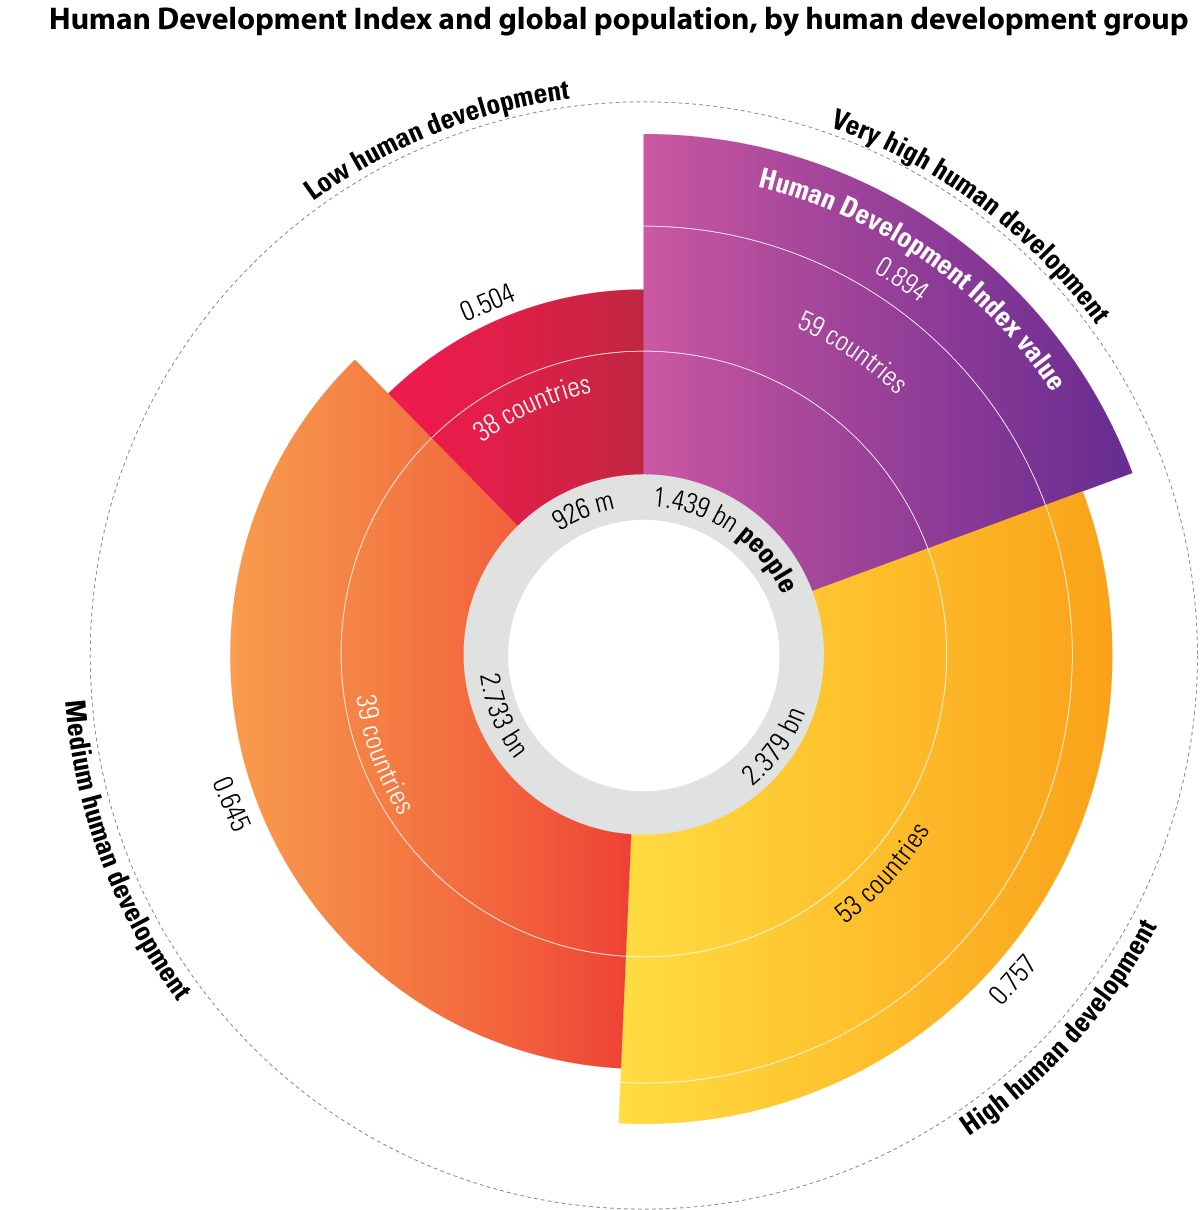
The 2018 Update presents HDI values for 189 countries and territories with the most recent data for 2017. Of these countries, 59 are in the very high human development group, 53 in the high, 39 in the medium and only 38 in the low.
The top five countries in the global HDI rankings are Norway (0.953), Switzerland (0.944), Australia (0.939), Ireland (0.938) and Germany (0.936).
The bottom five are Burundi (0.417), Chad (0.404), South Sudan (0.388), the Central African Republic (0.367) and Niger (0.354).
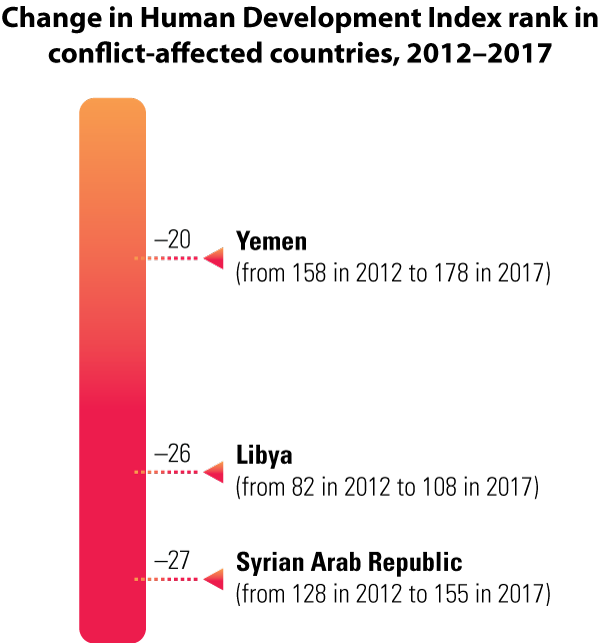
Ireland enjoyed the highest increase in HDI rank between 2012 and 2017 moving up 13 places, while Botswana, the Dominican Republic and Turkey were also developing strongly, each moving up eight places. All three steepest declines in human development ranking were countries in conflict: the Syrian Arab Republic had the largest decrease in HDI rank, falling 27 places, followed by Libya (26 places), and Yemen (20 places).
Six Key Findings from the 2018 Analysis
1. The World has made impressive progress in human development
Looking back over almost three decades, all regions and human development groups have made substantial progress.
The global HDI value in 2017 was 0.728, up about 21.7 percent from 1990. Across the world, people are living longer, are more educated and have greater opportunities.
Movements in the HDI are driven by changes in health, education and income. Health has improved considerably as shown by life expectancy at birth which has increased by almost seven years globally, with Sub-Saharan Africa and South Asia showing the greatest progress, each experiencing increases of about 11 years since 1990. And, today’s school-age children can expect to be in school for 3.4 years longer than those in 1990.
Although HDI values have been rising across all regions and human development groups, the rates vary significantly.
South Asia was the fastest growing region in the period from 1990 to 2017 (45.3%), followed by East Asia and the Pacific (41.8%), Sub-Saharan Africa (35%), Arab States (25.4%), Latin America and the Carribbean (21.1%), and Europe and Central Asia (18.1%)
2. Quality, not just quantity of human development, is important, and it reveals large deficits
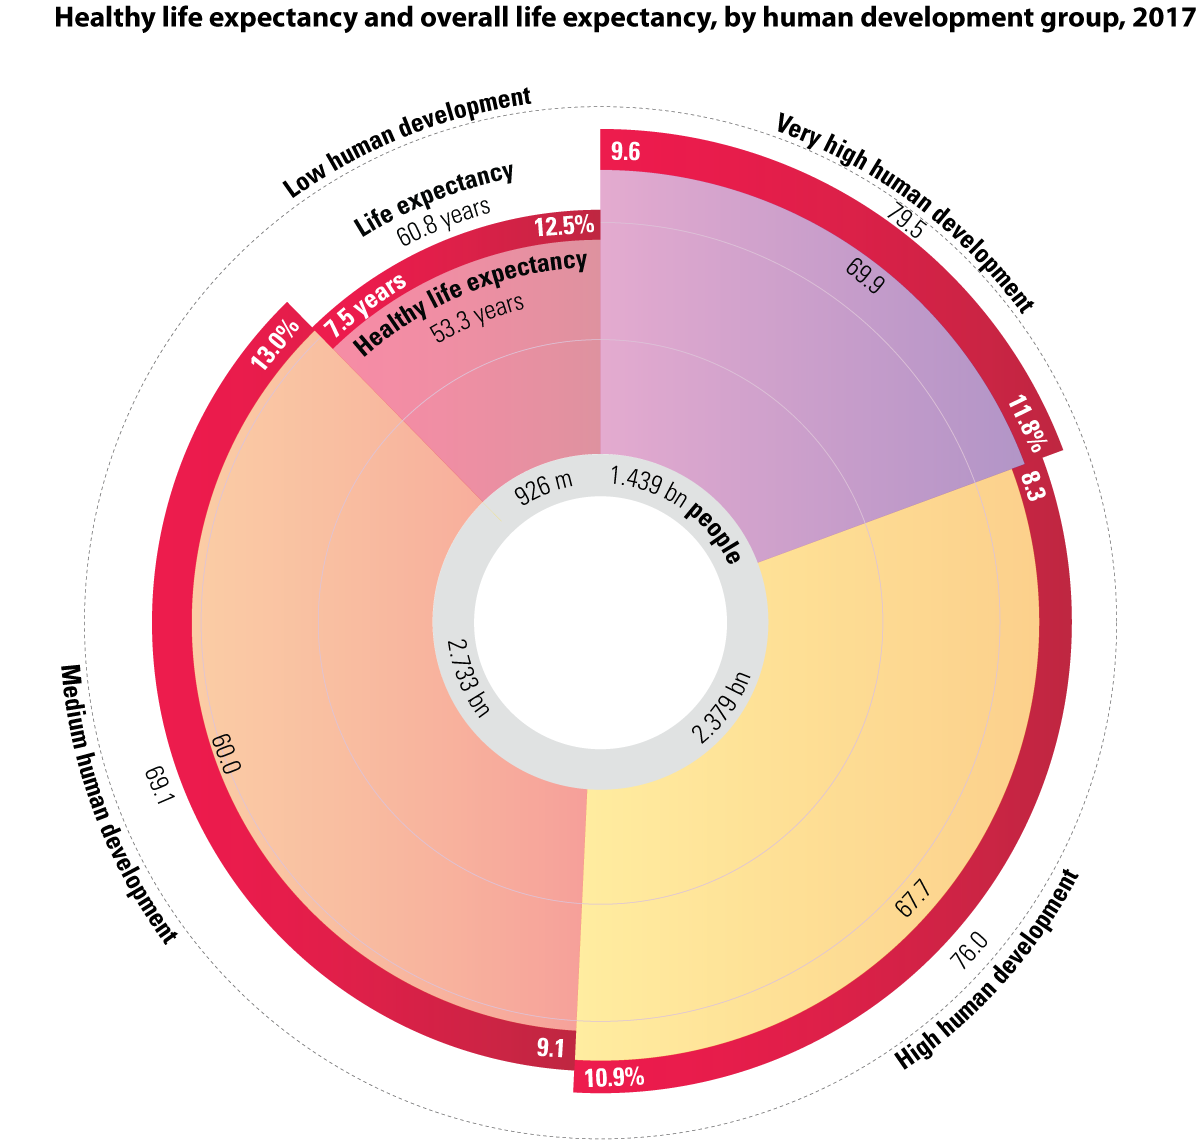
Most people today live longer, are more educated and have more access to goods and services than ever before. But living longer does not automatically mean more years spent enjoying life. For example, healthy life expectancy for countries of very high human development is approximately 70 years, whereas for countries of low human development it is approximately 53 years
In education, being in school longer does not automatically translate into equivalent capabilities and skills. So shifting the focus towards the quality of human development will be important in monitoring future progress (see dashboard).
3. Progress is not linear or guaranteed, and crises and challenges can reverse gains. Countries experiencing conflict show HDI losses, which can be felt for generations
Between 2012 and 2017 Libya, the Syrian Arab Republic and Yemen had falling HDI values and ranks—the direct effect of violent conflict. Although Lebanon is not directly involved in violent conflict, it has suffered spillovers from the conflict in Syria, hosting more than a million Syrian refugees.
4. Disparities between and within countries continue to stifle progress
Average HDI levels have risen significantly since 1990 – 22 percent globally and 51 percent in least developed countries. But there remain massive differences across the world in people’s well-being.
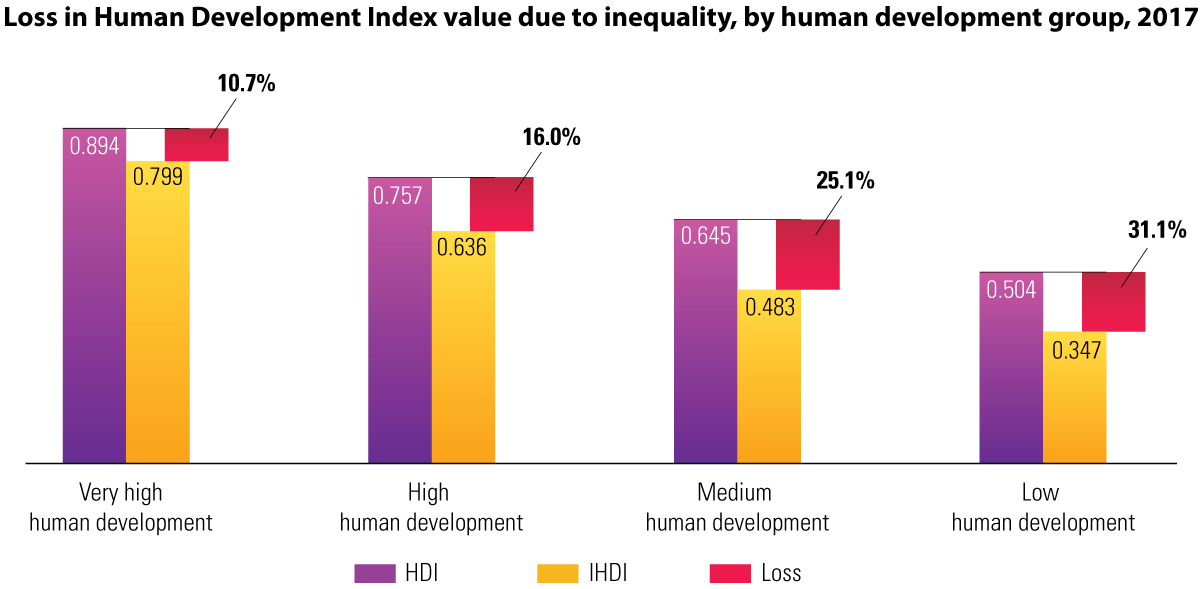
A closer look at the HDI’s components sheds light on the unequal distribution of outcomes in education, life expectancy and income within countries. The Inequality-Adjusted Human Development Index allows one to compare levels of inequality within countries, and the greater the inequality, the more a country’s HDI falls.
While significant inequality occurs in many countries, including in some of the wealthiest ones, on average it takes a bigger toll on countries with lower human development levels. Low and medium human development countries lose respectively 31 and 25 percent of their human development level from inequality, while for very high human development countries, the average loss is 11 percent.
5. Gender gaps in early years are closing, but inequalities persist in adulthood
One key source of inequality within countries is the gap in opportunities, achievements and empowerment between women and men. Worldwide the average HDI for women is six percent lower than for men, due to women’s lower income and educational attainment in many countries.
Although there has been laudable progress in the number of girls attending school, there remain big differences between other key aspects of men and women’s lives. Women’s empowerment remains a particular challenge.
Global labor force participation rates for women are lower than for men – 49 percent versus 75 percent. And when women are in the labor market, their unemployment rates are 24 percent higher than their male counterparts. Women globally also do much more unpaid domestic and care work than men.
Overall, women’s share of parliamentary seats remains low although it varies across regions, from 17.5 and 18 percent in South Asia and the Arab States, respectively; to 29 percent in Latin America and Caribbean and OECD countries. Violence against women affects all societies, and in some regions childhood marriage and high adolescence birth rates undermine the opportunities for many young women and girls. In South Asia, 29 percent of women between the ages of 20 and 24 were married before their 18th birthday.
High adolescent birth rates, early motherhood, and poor and unequal access to pre- and post-natal health services result in a high maternal mortality ratio. At 101 per 1,000 live births, Sub-Saharan Africa’s adolescent birth rate is more than twice the world average of 44 per 1,000 live births. Latin America and the Caribbean follows with 62 per 1,000 live births. Even though Sub-Saharan Africa’s maternal mortality ratio is 549 deaths per 100,000 live births, some countries in the region such as Cabo Verde have achieved a much lower rate (42 deaths per 100,000 live births).
The disadvantages facing women and girls are a major source of inequality and one of the greatest barriers to human development progress. Two composite indices and two statistical dashboards capture the disparities between men and women.
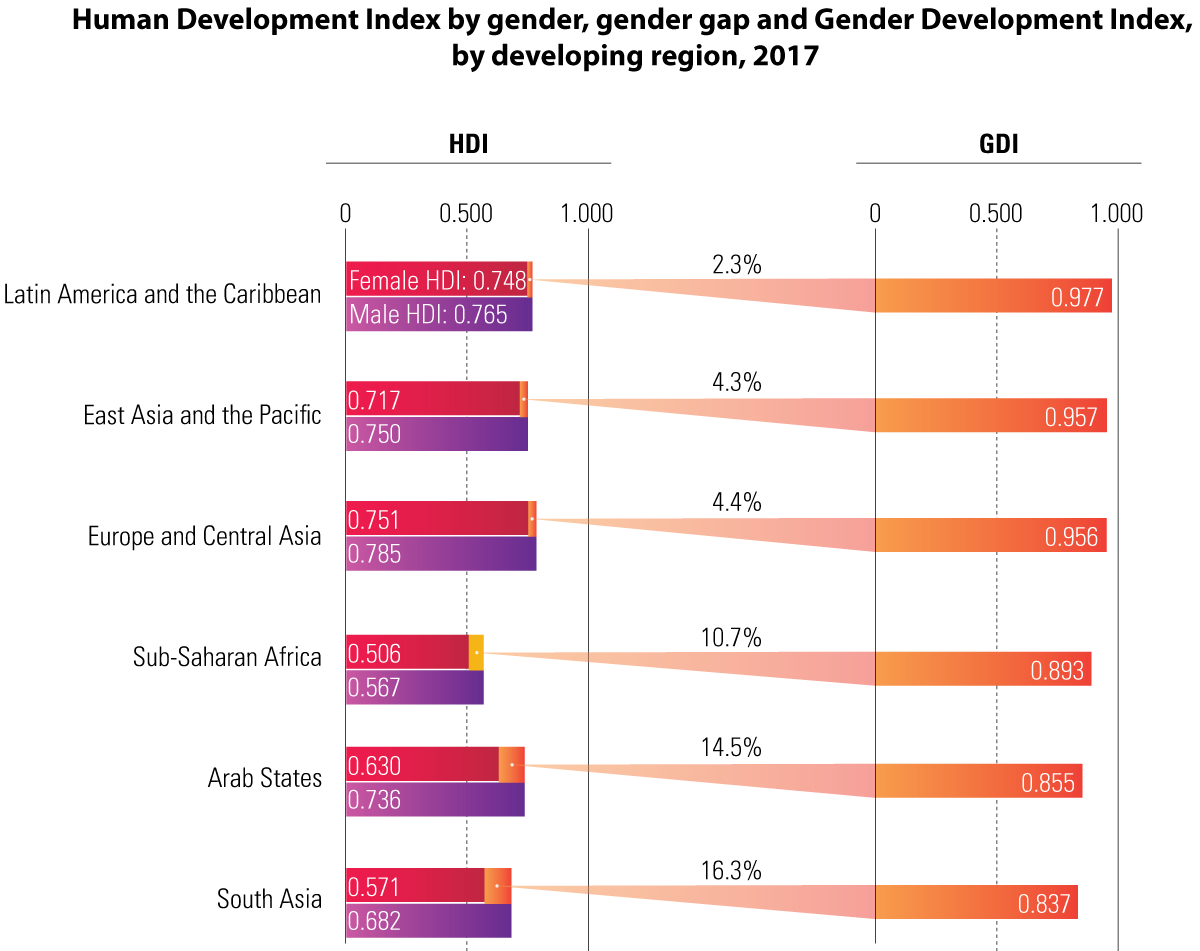
First is the GDI, which reports female and male achievements in the basic dimensions of human development. Worldwide, the average HDI value for women (0.705) is 5.9 percent lower than that for men (0.749) (see statistical table 4). Much of the gap is due to women’s lower income and educational attainment in many countries. The gender gap is widest in low human development countries, where the average HDI value is 13.8 percent lower for women than for men. Among developing regions the gender gap is narrowest in Latin America and the Caribbean (2.3 percent) and widest in South Asia (16.3 percent) and the Arab States (14.5 percent).
The second composite index to measure gender inequalities is the GII, which captures the inequalities women face in reproductive health, education, political representation and the labour market. The higher the GII value, the greater gender inequality—and all countries suffer some loss. The global GII value in 2017 was 0.441 (see statistical table 5). Among developing regions the GII value ranges from 0.270 for Europe and Central Asia to 0.531 for the Arab States to 0.569 in Sub-Saharan Africa. The value for OECD countries is 0.186.
A lifecycle perspective that identifies when interventions are particularly important can help in understanding and addressing the disparities between men and women (see dashboard 2).
6. Environmental degradation puts human development gains at risk
The degradation of the environment and atmosphere, coupled with significant declines in biodiversity, is linked to other development concerns ranging from declining food and water supplies to losses of livelihood and life from extreme weather events. This profoundly serious crisis threatens the human development of current and future generations.
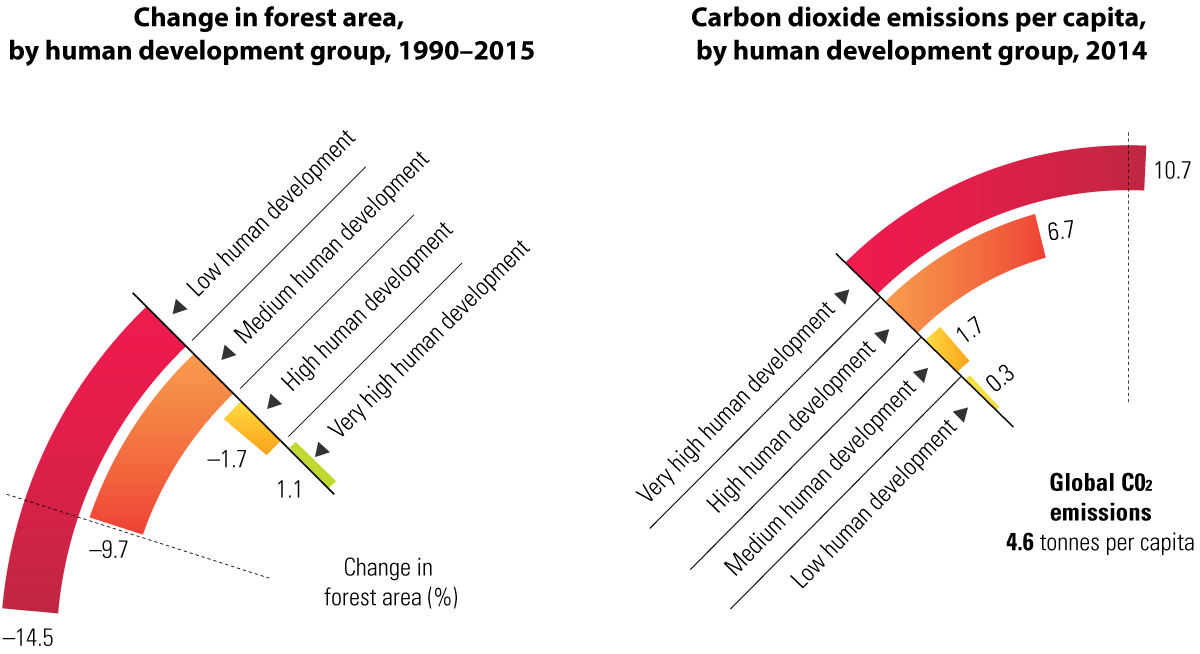
Business-as-usual approaches must change, with countries at different levels of human development exposed to and contributing to environmental degradation in different ways (see dashboard 4). Very high human development countries are the biggest contributors to climate change, with average carbon dioxide emissions per capita of 10.7 tonnes, compared with 0.3 tonne in low human development countries.
Linked to climate change and biodiversity loss, deforestation degrades land and reduces the quantity and quality of freshwater. The overall pace of forest loss has slowed in recent years, but the planet still lost 3.2 percent of its forests between 1990 and 2015. And low human development countries, many of them reservoirs of global biodiversity, lost 14.5 percent.
Statistical annex
The 2018 Update features 15 statistical tables in the annex as well as five statistical dashboards. The first five tables contain the family of composite human development indices and their components estimated by the HDRO (the MPI based on a revised methodology developed jointly with the Oxford Poverty and Human Development Initiative, will be available in due course). The remaining tables present a broader set of indicators related to human development.
Unless otherwise specified in the notes, tables use data available to the HDRO as of 14 September 2018. All indices and indicators, along with technical notes on the calculation of composite indices and additional source information, are available online at http://hdr.undp.org/en/data.
Countries and territories are ranked by 2017 Human Development Index (HDI) value. Robustness and reliability analysis has shown that for most countries the differences in HDI are not statistically significant at the fourth decimal place. For this reason countries with the same HDI value at three decimal places are listed with tied ranks.